
Below is the part of a weekly series of benchmarks provided by the team at Cannabis Benchmarks®.
—–
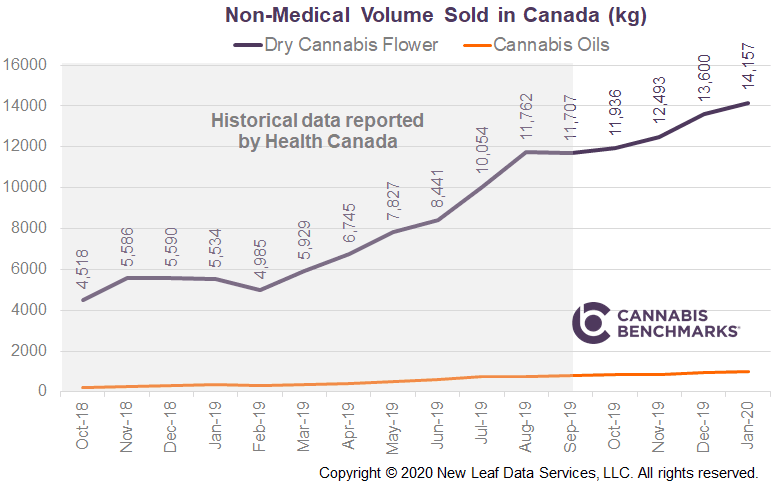
This week’s CCSI report reviews Cannabis Benchmarks models of non-medical cannabis sales revenue and volume from October 2019 through January 2020.
For that period, we show sales growing by an average of almost 6% each month, with January 2020’s sales revenue almost triple that of January 2019. Sales volume of dry cannabis flower for January 2020 reached over 14,000 kg, up by 255% year-over-year.
Finally, our breakdown of January 2020 sales volume by province shows Ontario accounting for almost a quarter of all product purchased nationwide, with Alberta and Quebec each making up over 20% of the total volume purchased by consumers that month.